
TL;DR
A skills graph is an AI-powered network that connects every skill in your organization to the people who hold them and the opportunities that demand them. It replaces static spreadsheets and outdated job descriptions with a living map of workforce capability. For HR leaders facing 39% skill disruption by 2030, it has become the foundation for internal mobility, workforce planning, and skills-based decision-making.
Josh Bersin recently called talent intelligence "one of the most existential changes in HR technology in decades." At the core of that shift sits a deceptively simple idea: stop thinking about your people as job titles, start thinking about them as portfolios of skills.
The problem is that most enterprise HR stacks were built around the job title era. HRIS systems track positions. ATS platforms screen resumes. LMS tools deliver courses. None of them was designed to answer the question every CHRO is now being asked by the CEO: what can our people actually do, and what could they do next?
The skills graph is the architecture that finally answers that question. This guide explains what a skills graph is, how it differs from a skills taxonomy or a competency framework, why it matters in 2026, and how leading enterprises like Alstom, SNCF, Veolia, and Société Générale are using one to reshape internal mobility at scale.
What is a skills graph?
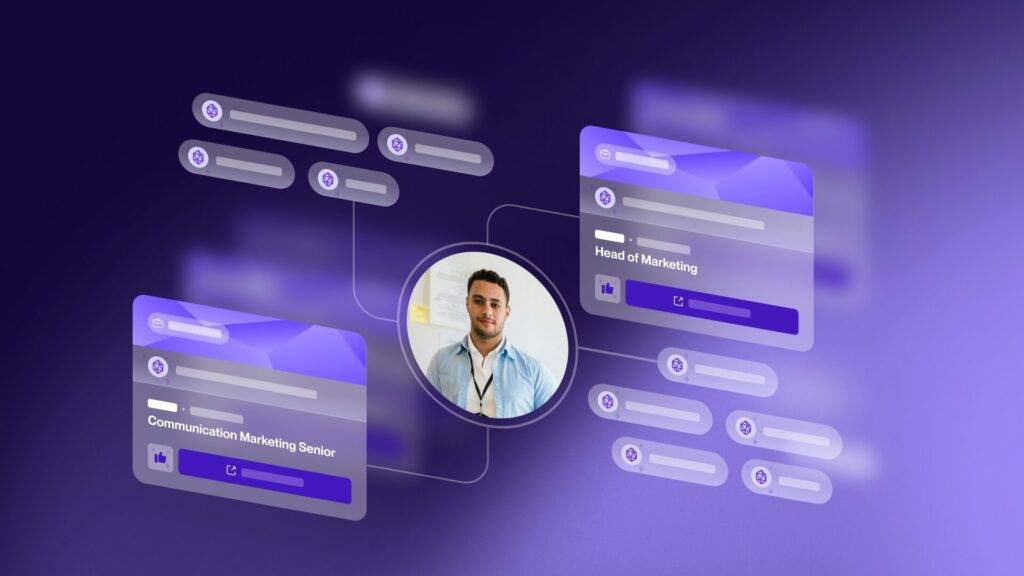
A skills graph is a dynamic network that maps three things at once: the skills present in your organization, the people who hold them, and the roles, projects, and learning opportunities that require them. Unlike a static taxonomy, a skills graph is continuously updated through AI inference from the data your HR systems already capture.
The three layers of a skills graph
- The skills layer. Each skill is a node, connected to adjacent skills (prerequisites, related capabilities, derived expertise). A graph node for "data analysis" connects to "SQL," "statistics," "data visualization," and "business intelligence."
- The people layer. Every employee is linked to the skills they hold, with inferred proficiency levels updated as their work evolves. No annual self-assessment required.
- The opportunity layer. Open roles, gigs, projects, and learning paths are themselves expressed as skill bundles, which makes matching computable.
Skills graph vs skills taxonomy vs competency framework
These three terms get used interchangeably, but they describe different things.
A competency framework is a structured list of behaviors expected for each role, typically maintained by HR. It's prescriptive and slow to update.
A skills taxonomy is a controlled vocabulary that defines and classifies skills consistently across an organization. ESCO, O*NET, and the WEF Global Skills Taxonomy are the most widely adopted open standards. A taxonomy is the dictionary.
A skills graph is the live network built on top of that taxonomy. It uses the dictionary, but it also tells you who in your company actually has which skills, how those skills relate to each other, and where the opportunities lie. The taxonomy is the map; the graph is Google Maps.
Why skills graphs matter in 2026
Because 39% of core skills will be transformed or outdated by 2030, the half-life of a technical skill is now under 2.5 years, and 73% of employers report struggling to fill open roles, the highest level in a decade. Static HR data simply can't keep pace.
Three converging pressures explain why skills graphs have moved from "nice-to-have" to "non-negotiable" on the CHRO agenda.
The AI and automation wave. According to the World Economic Forum's Future of Jobs Report 2025, 170 million new jobs will be created by 2030 and 92 million will be displaced. 85% of employers plan to prioritize workforce upskilling as their core response. You cannot upskill what you cannot see.
The cost of external hiring. With talent shortages at a decade-high (according to ManpowerGroup), filling roles externally is slower and more expensive than ever. Organizations with a skills graph can identify internal candidates whose existing capabilities cover 80-90% of an open role before they post the job externally.
Employee expectations have shifted. Workers want non-linear careers, lateral moves, project work, and continuous learning. A skills-based view of the workforce is what makes these expectations operationally possible. As Josh Bersin notes in his enterprise talent intelligence research, the companies winning the talent war are the ones treating skills data as a strategic asset.

How AI builds and maintains a skills graph
AI infers skills from existing HR data (resumes, performance reviews, project assignments, completed training, internal communications) without requiring employees to fill out self-assessment questionnaires. The graph then updates continuously as people complete projects, attend training, or change roles.
This is the fundamental shift. Old-world skills management depended on employees declaring what they knew. New-world skills graphs observe what they do.
At 365Talents, this inference engine draws on a reference library of over 10,600 skills across 45 languages. The platform sits above the existing HR stack (HRIS, ATS, LMS, collaboration tools) as a skills intelligence layer, integrating with more than 100 enterprise applications without replacing any of them.
What AI catches that humans and spreadsheets miss:
Skills shared across distant job families. A senior account manager and an internal consultant often share 60-70% of their underlying skill profile (negotiation, client discovery, solution structuring, stakeholder management). A skills graph surfaces these adjacencies; a job title comparison hides them.
Hidden skills from non-traditional sources. An employee who runs a side project, leads a non-profit, or has built expertise outside their formal job description. The graph picks up signals the resume never showed.
Emerging skills. New capabilities developed through cross-functional projects or recent training that haven't yet been reflected in the employee's official role.
5 high-impact use cases for a skills graph
1. Internal mobility and talent matching
Rather than posting a role and waiting for applications, a skills graph proactively identifies employees whose existing skills match 80%, 90%, or 100% of the requirement, and surfaces the gaps to close for partial matches. This is the foundation of an internal talent marketplace.
2. Strategic workforce planning and succession
By modeling current skill supply against future skill demand at a 3-to-5 year horizon, the graph turns workforce planning from a spreadsheet exercise into a data-driven discipline. Skill gaps become quantifiable, build-vs-buy decisions become defensible, and reskilling investments become prioritized. The same approach also accelerates succession planning: instead of relying on manager nominations, HR can identify ready-now successors based on verified skills data across the entire workforce.
3. Personalized learning recommendations
Connected to your LMS (Cornerstone, Degreed, LinkedIn Learning, Microsoft Viva Learning, 360Learning, and others), the skills graph recommends learning paths that bridge an employee's current skills to a desired role. Completion rates rise because learners finally understand why a course matters to them.
4. Skills-based hiring and internal-first sourcing
A skills graph creates a default reflex: before a role goes external, the system checks who internally already has 70%+ of the required skills. SNCF used this approach to save €100M by reducing reliance on contractors and external hires.
5. Diversity, equity, and reduced bias
By making decisions based on demonstrated skills rather than titles, degrees, or pedigree, the graph opens opportunities to candidates traditional resume screening would have filtered out. This is the operational backbone of what Josh Bersin and Deloitte both call the skills-based organization.

Curious how this works with the data you already have?
Your HRIS, ATS, and LMS already contain the raw material for a skills graph. The challenge isn't collection, it's activation. Read how leading organizations activate HRIS skills data in weeks, not months without asking a single employee to log in.
Read more

How to build a skills graph: a 3-step roadmap
Step 1: audit your data sources. Step 2: choose an interoperable platform anchored on open skills standards. Step 3: deploy progressively with strong employee activation. Building the graph is technical; getting people to use it is cultural.
Step 1: audit your existing HR data
Inventory what you already have: HRIS records, performance review text, completed training, project staffing history, ATS resume corpus. The skills graph is built from this raw material. You don't need to start from scratch; you need to connect what's there.
Step 2: choose a platform built on open standards
Three technical criteria separate enterprise-grade skills graph platforms from glorified taxonomies.
Open framework anchoring. Platforms that build on ESCO, O*NET, or the WEF Global Skills Taxonomy avoid lock-in and allow cross-walking between systems. Proprietary-only taxonomies create migration debt.
Inference-first design. The platform should generate skills profiles automatically from existing data, not require employees to fill out forms. Self-reported skills data is incomplete and decays fast.
Native HR ecosystem integration. The platform must connect to SAP SuccessFactors, Workday, Oracle HCM, your ATS, and your LMS without custom development. 365Talents, for example, connects to over 100 HR applications.
Step 3: drive activation, not just deployment
A skills graph that no one uses delivers zero ROI. Successful rollouts target high activation rates from day one. Alstom achieved 70% employee adoption within months of go-live, and other 365Talents customers like RTE have reached 81% activation across large populations.
The activation lever is the same in every successful deployment: make the graph immediately useful to the employee (career discovery, learning recommendations, internal opportunities) so they have a personal reason to keep their profile fresh.
What success looks like: enterprise outcomes
The business case for a skills graph is no longer theoretical. Across the 365Talents customer base, three categories of outcomes consistently appear.
Cost reduction. SNCF saved €100M by reducing contractor and agency spend through better internal visibility. The skills graph made it possible to identify internal candidates who would previously have been invisible.
Speed of mobility. Alstom doubled its activation rate within two weeks of deploying 365Talents compared to its previous solution, and was awarded the 2026 HR AI Trophy for its skills-based transformation program.
Workforce agility. Veolia uses the platform across multiple languages and geographies to maintain a unified skills view of its global workforce, enabling managers to source talent across borders for project work. For organizations facing reorganizations under time pressure, this kind of skills-based fact base makes a measurable difference in decision quality.
Conclusion
A skills graph isn't a feature, a dashboard, or a module bolted onto your HRIS. It is a new layer of intelligence on top of the data you already have, designed to answer the questions traditional HR tech was never built to ask.
The organizations that move first are not just optimizing internal mobility. They are establishing a structural advantage in how they identify, develop, and deploy talent in a labor market where 39% of skills will be obsolete by the end of the decade.
Start with what you have: see your workforce skills in weeks
You don't need an enterprise-wide rollout, a self-assessment campaign, or a multi-year taxonomy project to get started. 365Talents Skills View activates the skills data already sitting in your HRIS, ATS, and LMS to deliver a dynamic skills map of your workforce, without requiring a single employee to log in.
Built for HR teams who need answers now, not next year.
Get the Skills View guide to see how it works...
What data it activates, and the outcomes it delivers in succession planning, internal mobility, and workforce reorganization.
Skills View from 365Talents
Already evaluating skills intelligence platforms? Talk to a 365Talents expert for a personalized walkthrough of your use case.
FAQ
What is a skills graph?
A skills graph is a dynamic, AI-powered network that maps the skills in an organization, the people who hold them, and the opportunities that require them. Unlike a static skills inventory or spreadsheet, a skills graph updates continuously as employees gain new capabilities, complete projects, or take on new roles.
What's the difference between a skills graph and a skills taxonomy?
A skills taxonomy is a controlled vocabulary that defines and classifies skills (ESCO, O*NET, WEF). A skills graph is the live network built on top of that taxonomy, connecting taxonomy skills to actual employees, roles, and opportunities inside your organization. The taxonomy is the dictionary; the graph is the conversation.
How does AI build a skills graph?
AI infers skills from existing HR data sources (resumes, performance reviews, completed training, project assignments, internal communications) without requiring employees to fill out self-assessments. Machine learning models identify both explicit skills mentioned in the data and implicit skills demonstrated through work history, then map relationships between them.
What's the difference between talent intelligence and skills intelligence?
Skills intelligence is the foundational layer: AI-powered understanding of who has which skills. Talent intelligence is the decision layer built on top: using that skills data to make hiring, mobility, succession, and workforce planning decisions. You can't have meaningful talent intelligence without skills intelligence underneath.
How long does it take to deploy a skills graph?
Enterprise deployments typically run a pilot within 4-8 weeks and reach full activation within 3-6 months. The variable is rarely the technology, which integrates with existing HR systems. The variable is change management and employee adoption, which is why activation rate (not deployment date) is the metric that matters.
Do I need to replace my HRIS to deploy a skills graph?
No. Modern skills graph platforms sit on top of your existing HR stack (Workday, SAP SuccessFactors, Oracle HCM) as an intelligence layer, integrating without replacing. 365Talents, for example, connects to over 100 HR applications and does not require any migration from your system of record.
What ROI can I expect from a skills graph?
Typical outcomes include reduced external hiring costs (SNCF saved €100M by reducing contractor reliance), faster time-to-fill for internal roles, higher learning completion rates, improved retention through career mobility, and reduced bias in talent decisions. ROI is usually measurable within 12 months of full deployment.